
4 min read
Relationship status aside, It’s hard to avoid Valentine’s Day: from your apps to in-store campaigns to cheesy e-cards filling up your inbox (thanks for the forward, Auntie Lynn), it’s everywhere. You may spend time with a loved one, over-indulge in your favourite chocolate, or make a mockery of the whole thing and stock up on clearance candy on the 15th. Whatever your plans, we’re all targets for Cupid’s bow in one way or another and most companies are hoping you fall in love – with their products.

Love in the time of data
Using emotions to sell products is pretty fundamental stuff in marketing and advertising. Even though Valentine’s Day is traditionally a celebration of love, romance, and admiration, businesses use this opportunity to increase sales of their products and services. You may be single, but companies are making an effort to show you some love on the 14th, so let’s take a deeper dive into how businesses are tapping into your love life (no matter how active it is), using social media data to gain customer insights.
Have you ever received a marketing email from one of your favourite brands and it felt like they somehow read your mind? How did they know that your bottle of face lotion is almost empty? Of course you’d like to place another order, they’ve thrown in free shipping! While mind-reading is still exclusive to fiction, tapping into data gets these companies most of the way there.
If you have an online presence, you’re generating this data. And it’s probably used more than you think. If this is news to you, you’re not alone. United States Senator Orrin Hatch was at least somewhat surprised by the arrangement when he asked Mark Zuckerberg how Facebook could sustain a business model when people don’t pay for the service. Zuck looked like briefly confused before answering, only somewhat patronizingly: “Senator, we run ads.”
The fact is that modern marketing runs on the back of social media data, and we have generally decided to give away information about how we share, view, and engage with content in return for free usage of sites like Facebook. Think of it like a symbiotic relationship. How’s that for a Valentine’s Day message?
It goes without saying that this type of data presents massive value to marketers. Because it gives near real-time insight into target groups, marketers can create hyper-targeted campaigns with granular focus. And if you’re a candy company or a florist, February 14th is when you want to put your best foot forward.
The use case
As a data scientist, I wanted to look into some of this data. In order to think like a marketing professional I partnered with our marketing team to learn more about how businesses target consumers on Valentine's Day. What’s their approach? How do they segment their audience? Do they target specific people, or are they more general? To put it bluntly: is the algorithm Cupid, or stupid?
I needed a source, so I turned to Twitter. Twitter exposes a public API that you can use to search hashtags, and I used it to tap into the general sentiment of specific tweets. Companies use Twitter feeds like this to strengthen their relationships with customers, attract new ones, and cash in on special occasions.
Let’s take a look at the data behind love
Using the Twitter API, I collected 1207 tweets between February 1st and February 12th, 2020, gathering username, description, location, the tweet itself, and the time that tweet was posted.
As you can imagine, this is high season for tweets about Valentine’s Day (Halloween isn’t trending in February – weird, right?). For this experiment we wanted to focus our analysis on businesses, but this presented some practical difficulties. On Twitter, there is no distinction between individual users and business accounts, which makes differentiating between the two a monumental task. As a quick solution we decided to only use verified accounts, which gave us a good baseline.
From there, I set off to do some analysis. Specifically, using only “#Valentine”, I wanted to find out the answers to the following questions:
- Where are the businesses that are using this hashtag located?
- Was there a trend in the use of “#Valentine”?
- Which other hashtags co-existed with “#Valentine”?
- Was there a trend in the day of the week in which the tweets were generated?
- What kinds of companies use Valentine’s Day as a sales opportunity?
- What did businesses tweet about?
So what did the data reveal?
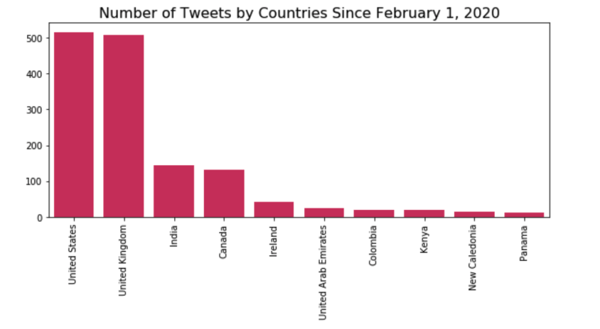
Where are the businesses that are using this hashtag located?
Using information provided by the tweet author, performing a count by country reveals that the majority of the tweets were posted from the United States, followed closely by the UK.
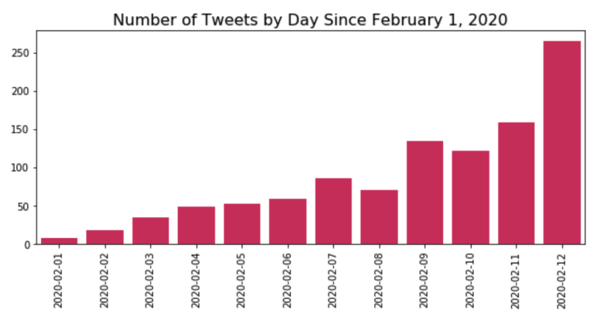
Was there a trend in the use of “#Valentine”?
Plotting the number of “#Valentine” tweets by day indicates a positive trend from February 1st to February 12th. We can see on the bar chart below that the number of tweets posted on February 12th has more than doubled from a week ago. This trend makes sense. As the actual day draws closer, more companies want to make use of their social media channels to drive sales.
Was there a trend in the day of week in which the tweets were generated?
Counting the number of tweets posted by weekday, “#Valentine” tweets seem to favour Wednesday.
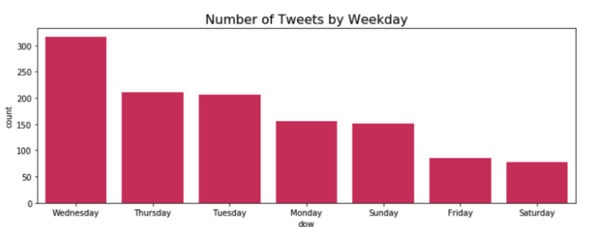
Could there be a reason for this?
If we look at the data collection window, the tweets were collected between the 1st and the 12th of February. Within this period, there were two Sundays, two Mondays, two Tuesdays, and two Wednesdays, with the most recent day before the termination of the data collection period being a Wednesday. Given that there was an upward trend in the number of tweets posted since the beginning of the data collection period, it makes sense that there were the most tweet count on Wednesday. We can also assume that if we were to continue collecting tweets until February 14th, we would again see more tweets about Valentine’s Day on Thursday, and more again on Friday.
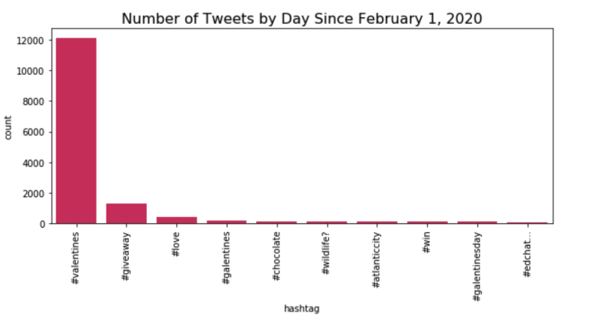
What other hashtags were likely to be associated with “#Valentine”?
There were a number of hashtags very closely related to “#Valentine”. For this reason, I’ve grouped them together into one group under the label “#Valentines”. Given the number of times “#Valentine” and its variations came up (almost 12000x), it's clear that when people want their tweets to be seen, they use multiple similar hashtags to increase exposure. Following the “#Valentine” and its variations, are “#giveaway”, “#love”, “#galentine” (thanks, Amy Poehler), “#chocolate”, etc. Interestingly enough, almost all these variations are related to a commercialized version of Valentine’s Day.
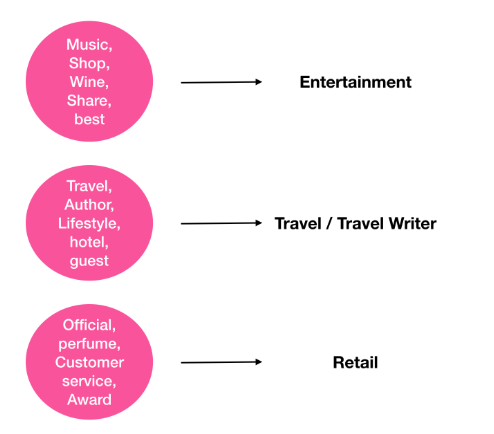
What kinds of companies use Valentine’s Day as a sales opportunity?
Using user description as my body of text, and applying a Topic Modelling algorithm (LDA), we were able to discern that three types of users were most likely to be tweeting about Valentine’s Day.
Based on analysis, the types of companies that participate in leveraging the #Valentines Day are:
 What did businesses tweet about?
Interestingly, applying a Topic Modelling algorithm, I was unable to reliably train a model to discover underlying topics because many of the tweets were using the same or very similar words. As such, the model indicated that there is really only one underlying topic. So instead, after removing stopwords, I did a word count to see what words were most likely to appear in tweets.
The top 10 most common words (with ties) can be grouped into 4 categories:
The most dominant category is feelings and emotions, but you probably didn't need the data to surmise that. Second to emotions is a date category – not 'movie night' or 'restaurant,' but an indication of a duration, like week or year. Things make up the third category: chocolate, cards, treats, and everything else that the commercial side of Valentine's Day is all about. The fourth category covers Marketing terms like 'offer,' 'free,' and 'send.'
That’s the way the (heart-shaped) cookie crumbles
Whether or not you’re celebrating Valentine’s Day with your true love, it’s evident that businesses have fallen hard for data analysis to fuel their holiday marketing campaigns. There's a tremendous amount of insight that public data provides, but it’s not always presented in a usable way, as we’ve seen. Like any data, the cleansing and prep stages are crucial to meaningful analysis (Read more about The Difference Between Data Cleansing and Data Enrichment). As more data becomes more available to more companies, the depth of connection a company can make increases.
ThinkData offers a lot more data than that – over 250,000 thousand datasets from more than 75 countries around the world. Request a consultation with one of our data experts to talk about external data.
4 min read
How to better leverage data for risk management and crisis response
It’s becoming increasingly difficult to manage risk in a global climate that’s growing in complexity. On the other side of this coin, however, is an...
3 min read